Understand climate risk at the property level.
Measure current and future exposure to wildfire, river flood, surface flood, coastal flood, severe wind and extreme heat for one property or an entire portfolio.
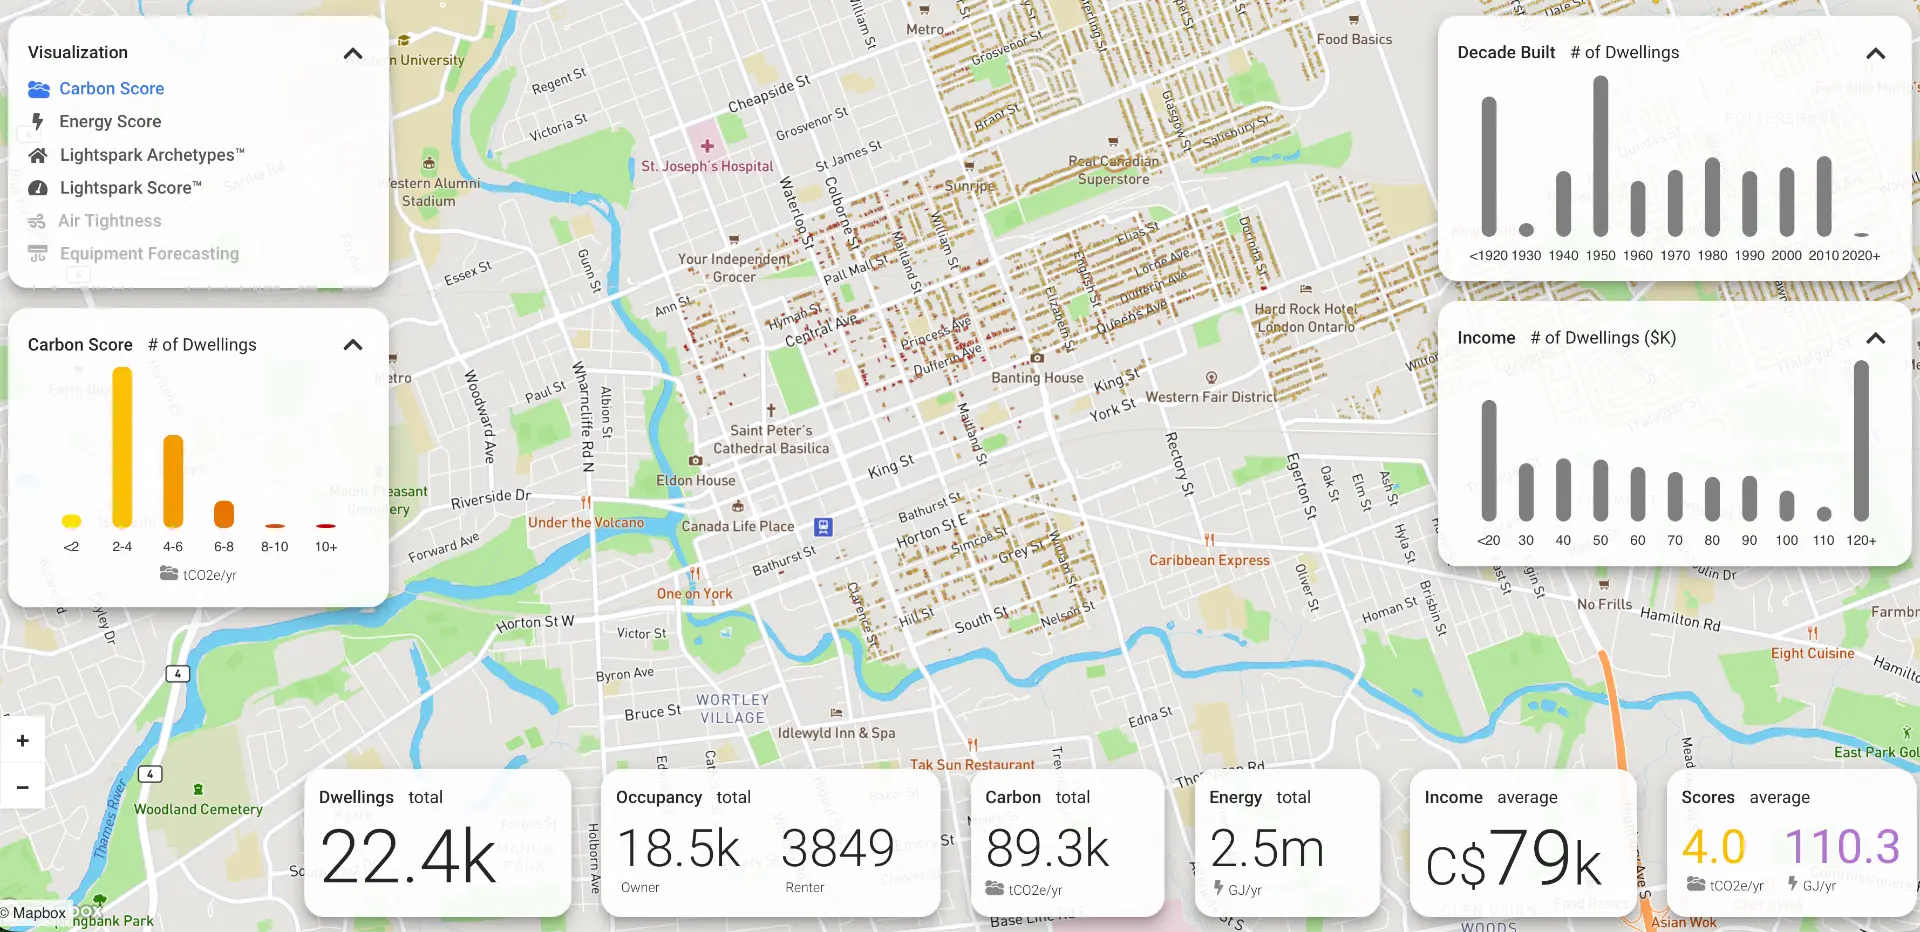
Geospatial evidence — hazard exposure mapped to individual property footprints.
Six hazards, modelled for every address.
Wildfire
Exposure from fuel, slope, proximity and historic fire behaviour.
River & surface flood
Fluvial and pluvial exposure modelled at the property footprint.
Coastal flood
Storm surge and sea-level exposure for coastal properties.
Severe wind
Wind speed return periods and structural vulnerability.
Extreme heat
Heat-day frequency and indoor overheating potential.
Compound risk
Where multiple hazards intersect on the same property.
“By focussing on a deep data warehouse, they have developed a solution that will allow insurers, financial institutions and homeowners to make timely decisions to make the investments that will reduce risks and costs.”

Tamara Vrooman, O.B.C.
Former CEO, VanCity Credit Union and Chair Canada Infrastructure Bank, and currently CEO Vancouver International Airport
From one property to an entire portfolio.
Annual probabilities
The modelled likelihood of each hazard affecting the property in a given year.
Return-period intensity
Hazard intensity at standard return periods so exposure can be compared consistently.
Future climate scenarios
Forward-looking exposure under recognized emissions and warming scenarios.
Portfolio accumulation
Aggregated exposure across a book of properties, by hazard and geography.
Model confidence
Confidence indicators and documented limitations alongside every score.
Mitigation opportunities
The property-level improvements that measurably reduce exposure.
HorizonIQ supports regulatory and disclosure work, including climate scenario analysis and financed-emissions reporting. Model confidence, sample coverage and limitations are documented alongside every output.
“Lightspark can enable Leading Banks to identify the most impactful opportunities for energy and carbon savings within their communities with greater precision.”

Chris Castro
former Chief of Staff, U.S. Department of Energy; Executive Director, Climate First Bank
“If we are really going to scale energy retrofits across North America, we need to use machine learning and AI to identify highest energy and carbon using buildings, develop retrofit programs, and support homeowners in making wise decisions.”

Sadhu Johnston
former City Manager and Deputy City Manager, City of Vancouver; former Chief Environmental Officer, City of Chicago
Choose the view that fits your portfolio.
HorizonIQ for Banks
Collateral screening, climate scenario analysis and disclosure support across a mortgage portfolio.
HorizonIQ for Insurers
Risk selection, pricing, accumulation and policyholder mitigation at the property level.
HorizonIQ for Governments
Community resilience planning, equity-aware prioritization and public reporting.